Monitoring Dataflow Memory
Hey Dmitri, I have explored options of looking into memory monitoring of dataflow. The thing is that we create dataflow jobs using terraform, and that does not have the –experiments option. Not sure what the option is there.
This is the message I’ve recently received from one of my colleagues who was looking into opportunities to scale down our Dataflow jobs. When you don’t know how much memory your Dataflow job is consuming, you will either overprovision and waste resources or underprovision and cause unnecessary job crashes. Dataflow documentation seems to avoid the topic of memory monitoring altogether, where the most relevant information is --experiments=enable_stackdriver_agent_metrics flag which allows to “monitor persistent disk, CPU, network, and process metrics from your Dataflow worker VM instances”.
Manually check memory consumption
Is there any way at all to tell current memory consumption on the instance that runs Dataflow job? By SSHing into one of the Dataflow instances and running free -mh I’ve confirmed that it is at least possible. An instance that I’ve checked showed a very low memory utilisation.
free -mh
total        used        free      shared  buff/cache   available
Mem:          7.3Gi       1.9Gi       3.5Gi       0.0Ki       1.9Gi       5.2Gi
Swap:            0B          0B          0B
Install a monitoring agent
Given that we do have access to the Dataflow instances, it should be possible to install a host monitoring of some sort. I am not a huge fan of Stackdriver, but I do like Metricbeat and pay for Elasticsearch cloud service. I’ve realised that GCP runs Dataflow on top of Container-Optimized OS and conventional methods of installing Metricbeat didn’t work. However, the solution is in the name of the Container-Optimized OS - container. You can run Metricbeat in a docker container without installing it on the host using the following command:
# Create bridge docker network
sudo docker network create metricbeat
# Run metricbeat as a container using bridge network
sudo docker run -d --user=root --user=root  \
  --volume="/var/run/docker.sock:/var/run/docker.sock:ro" \
  --volume="/sys/fs/cgroup:/hostfs/sys/fs/cgroup:ro" \
  --volume="/proc:/hostfs/proc:ro" --volume="/:/hostfs:ro" \
  --net metricbeat docker.elastic.co/beats/metricbeat:7.6.2 \
  -e -E output.elasticsearch.hosts=["elasticsearch:9200"] \
  -E cloud.id=$SOME_CLOUD_ID \
  -E output.elasticsearch.username=$USERNAME \
  -E output.elasticsearch.password=$PASSWORD \
  -E name="$HOSTNAME"
You may wonder why did I create a dedicated docker network? Apparently docker networks created by the Dataflow do not include bridge network, therefore Metricbeat was failing to resolve DNS record with the Elasticsearch. This little workaround has fixed the DNS resolution problem.
docker ps now shows Dataflow container along with a Metricbeat container running.
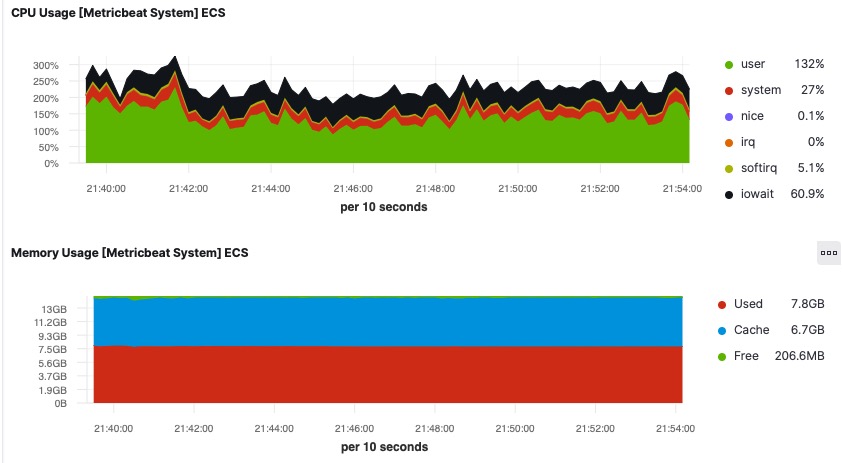
Automate agent installation
We’ve now installed the monitoring agent on a single instance and received detailed metrics which include memory monitoring. However, if you need to do something manually more than 3 times, it can be defined as toil and it must be automated away. We at loveholidays run tens of Dataflow jobs and many more instances, which start and stop at different times. How can we automate the monitoring agent installation for all of the Dataflow instances in our data projects?
Startup script to the rescue. GCE allows running arbitrary startup script against all instances in the project via startup-script Compute Metadata entry. Please note, it is only applied when an instance is starting up/restarting.
gcloud compute project-info add-metadata --metadata=startup-script='#! /bin/bash
  # Network creation is followed by || true to ignore error when this commands fails
  # on consequent restarts as we have already created the network.
  sudo docker network create metricbeat || true
  sudo docker run -d --user=root --user=root  \
  --volume="/var/run/docker.sock:/var/run/docker.sock:ro" \
  --volume="/sys/fs/cgroup:/hostfs/sys/fs/cgroup:ro" \
  --volume="/proc:/hostfs/proc:ro" --volume="/:/hostfs:ro" \
  --net metricbeat docker.elastic.co/beats/metricbeat:7.6.2 \
  -e -E output.elasticsearch.hosts=["elasticsearch:9200"] \
  -E cloud.id=$SOME_CLOUD_ID \
  -E output.elasticsearch.username=$USERNAME \
  -E output.elasticsearch.password=$PASSWORD \
  -E name="$HOSTNAME"'
Now, every new Dataflow job launched in the project will automatically get a monitoring agent installed and report instance metrics into Elasticsearch.
Improvements and alternatives
- GCE
startup-scriptcan be substituted forstartup-script-urlwhich points at script location in the bucket. While it makes metadata neater, you will now have to manage IAM permissions between the bucket and the instances. - Above script is optimistic and assume that only COS instances will be run in the project, it is likely, not true and you might want to add additional conditional logic to decide whether it is a valid instance to install an agent on.
- Metricbeat is far from the only available agent, a quick search found Datadog as an alternative. You can always package your favourite infrastructure monitoring agent into the Docker image to do something similar.